Titash Products
Sales Dashboard-2023
Displays monthly sales revenue alongside order volumes. Notably, sales peaked early in the year and ...
Github Link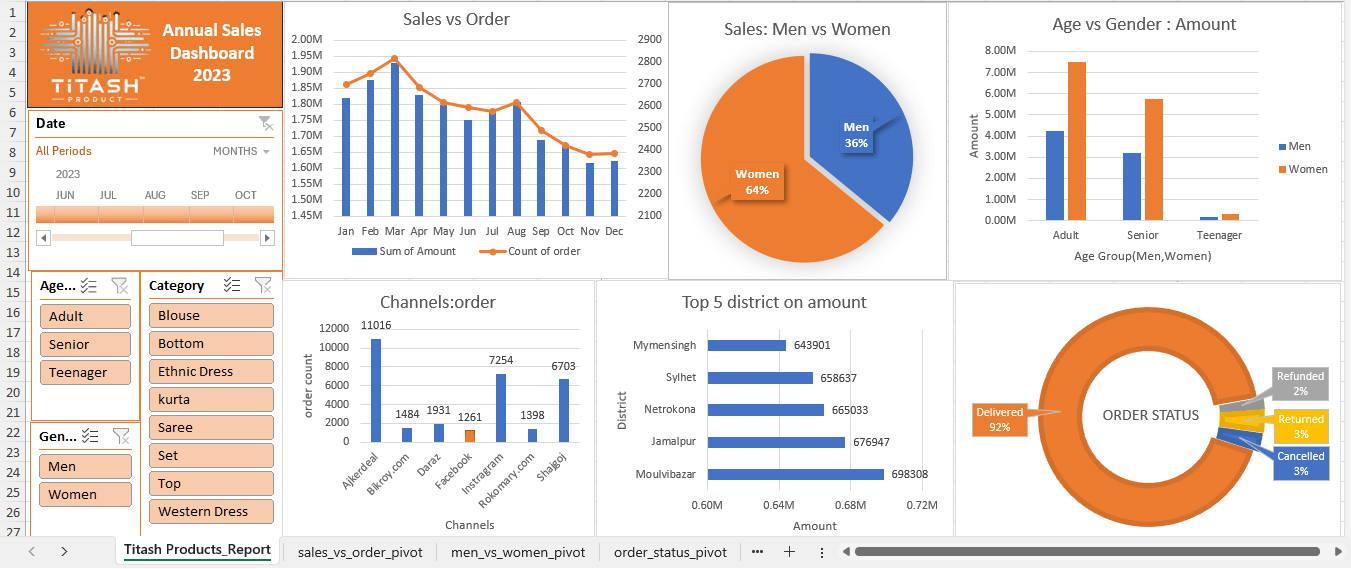
ABS Superstore
Sales Performance Dashboard
Displays monthly sales and profit trends, highlighting seasonal variations and growth patterns from ...
Github Link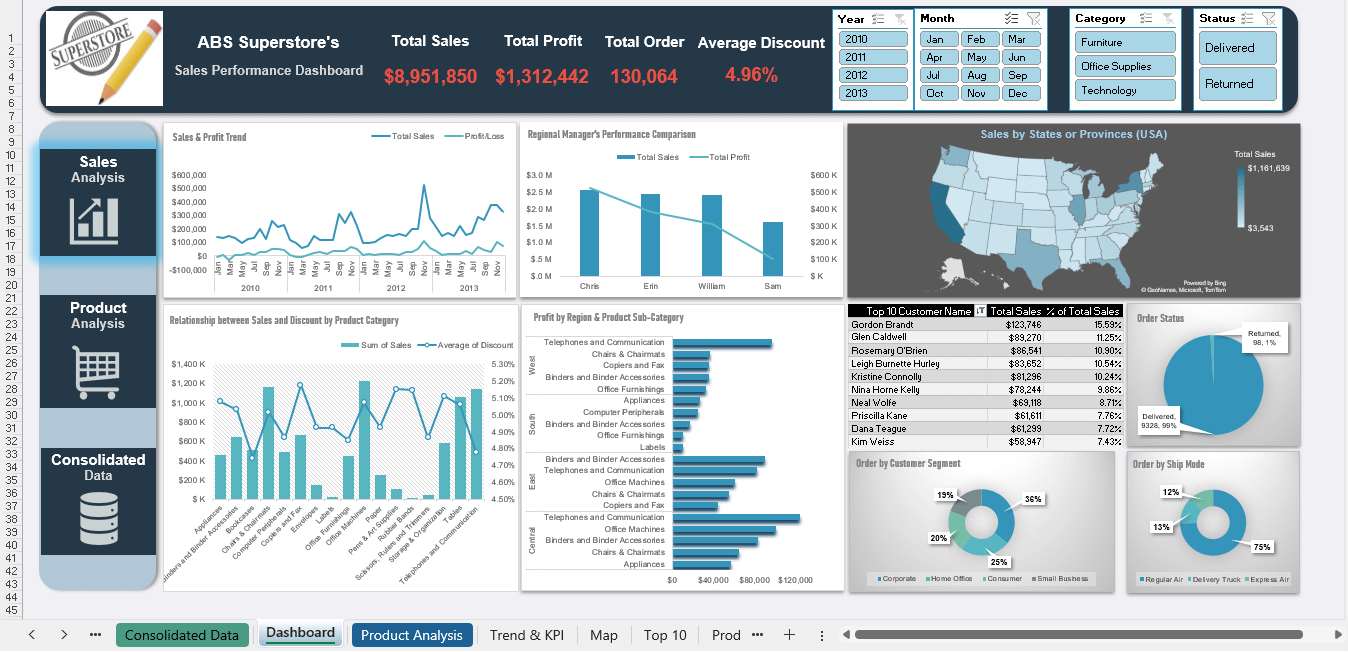
Supermarket
Sales Dashboard
The Super Market Dashboard provides a comprehensive view of sales, profits, and performance metrics,...
Github Link
Anonymous
Road Accident Dashboard
The dashboard shows a total of 417,883 casualties.Fatal casualties are relatively low (7,135) compar...
Github Link
Digital E-commerce
Sales Dashboard
This report provides a comprehensive analysis of profitability across various dimensions. Region-wis...
Github LinkLive Preview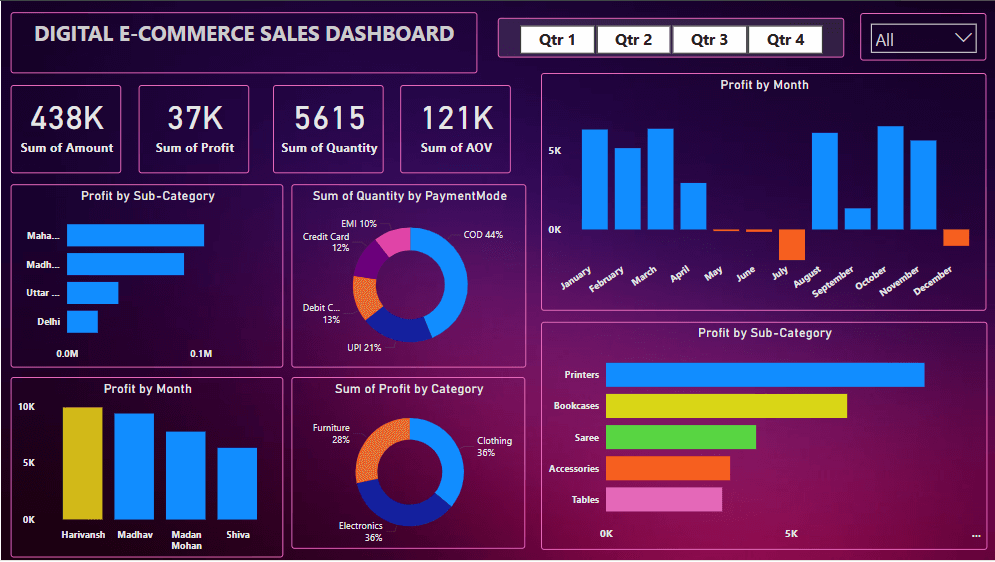
Sales Performance
The Sales Performance Dashboard for Steele Chain Gear provides insights into key metrics, product or...
Github LinkLive Preview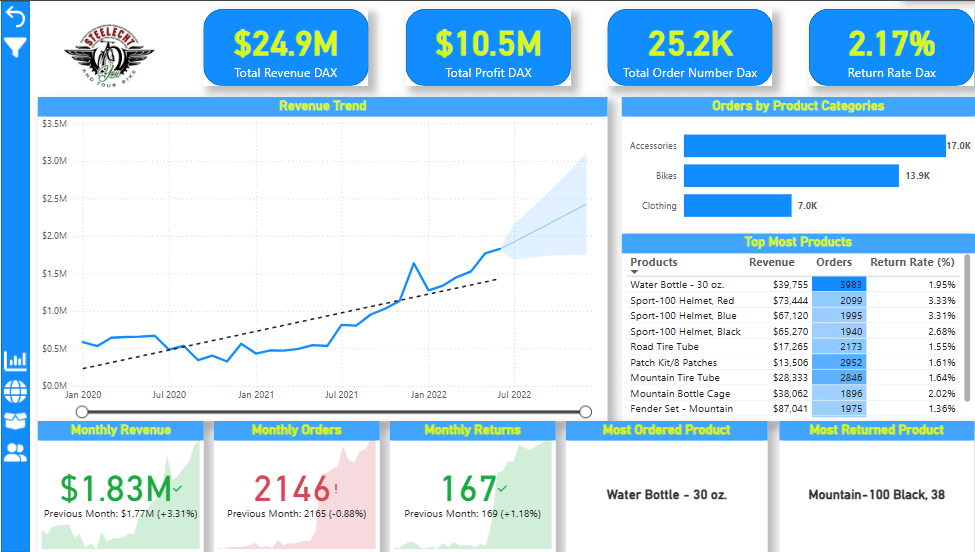
Health care
Hospital Visits
The healthcare dashboard shows 500K hospital visits, with 53.49% female visitors and 46.51% male. Mo...
Github LinkLive Preview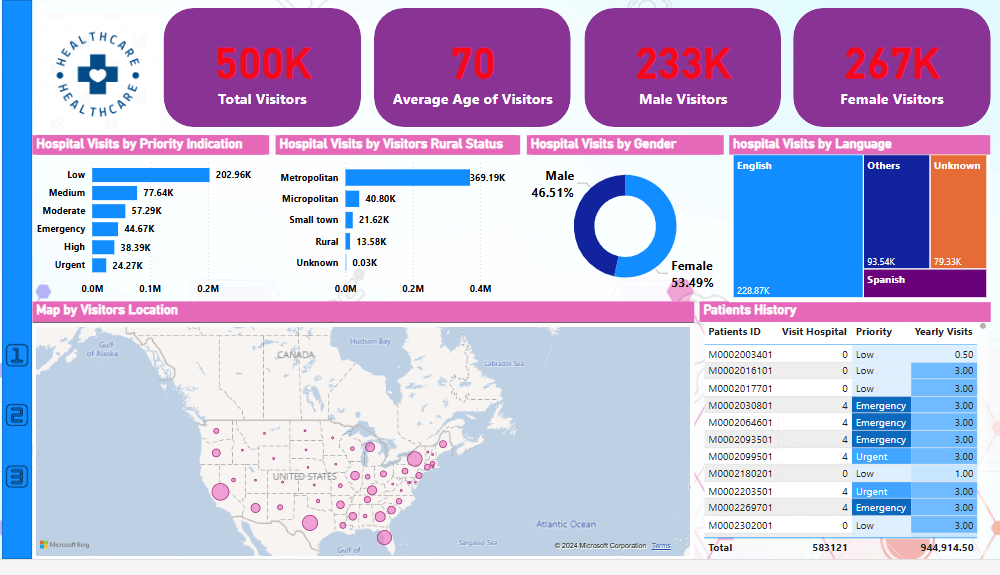
Music Store Data Analysis with SQL
This project uses SQL to analyze a music store database, focusing on customer behavior, sales trends...
Github Link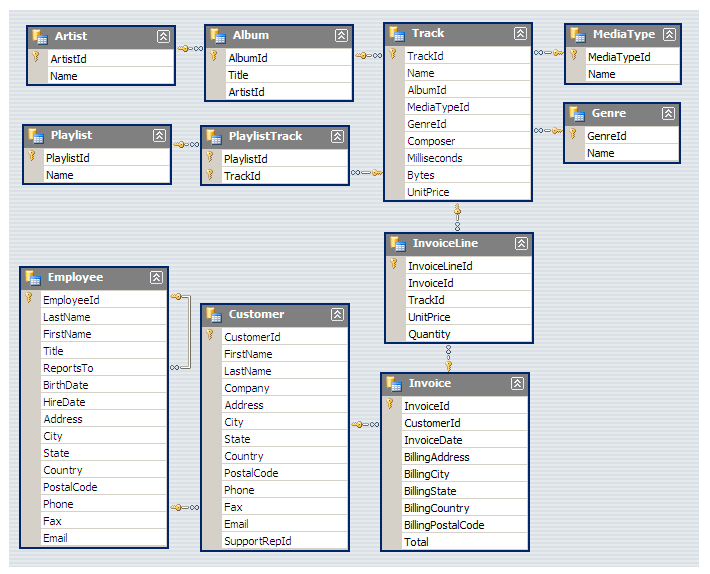
Retail Store analysis with SQL
This project involves creating and analyzing a retail sales database to gain valuable business insig...
Github Link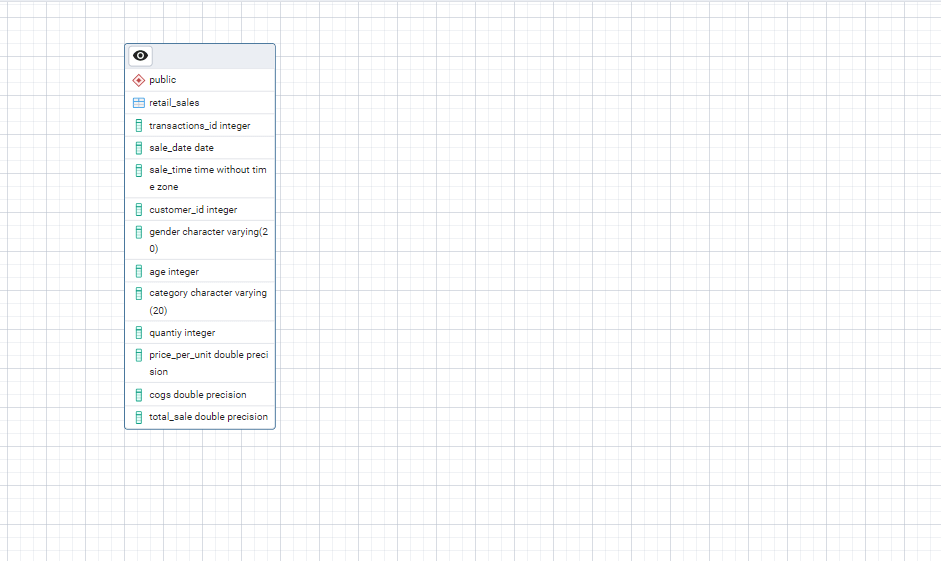
Predicting House Prices in Dhaka, Bangladesh Using Linear Regression Analysis with Python
Explore the project to click live preview. I have used python library pandas, numpy, matplotlib to p...
Live Preview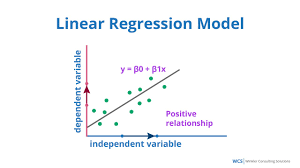
Forecasting Air Passenger Numbers for the Next Two Years Using Time Series Analysis with Python
Explore the project to click live preview.
Live Preview